PROCESS MODELING & RECONCILIATION
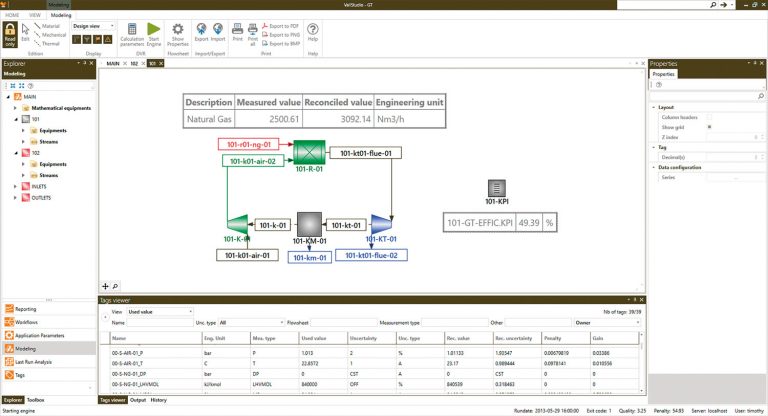
The modeling capabilities of ValiStudio allow creation of all the different units and streams needed for an accurate representation of the process. These units can be grouped in separate Process Flow Diagrams for a clear visualization of the process.
The modeling toolbox contains all the different kinds of process equipment (pumps, heat exchangers, etc.).
A thermodynamic library gives access to a list of chemical compounds with their respective thermodynamic parameters for accurate calculations. VALI is also compliant with CAPE-OPEN.
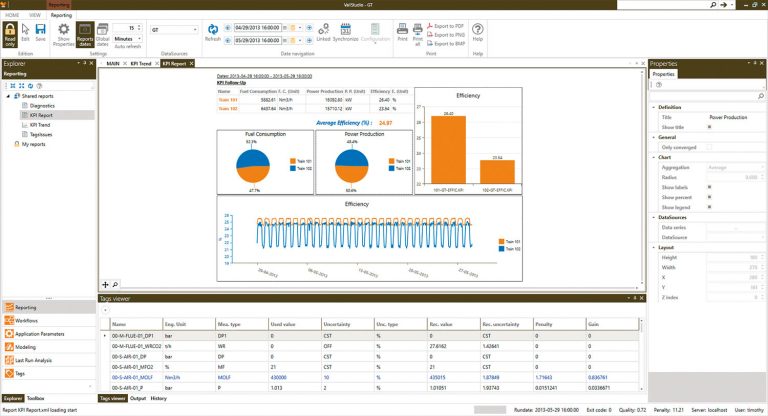
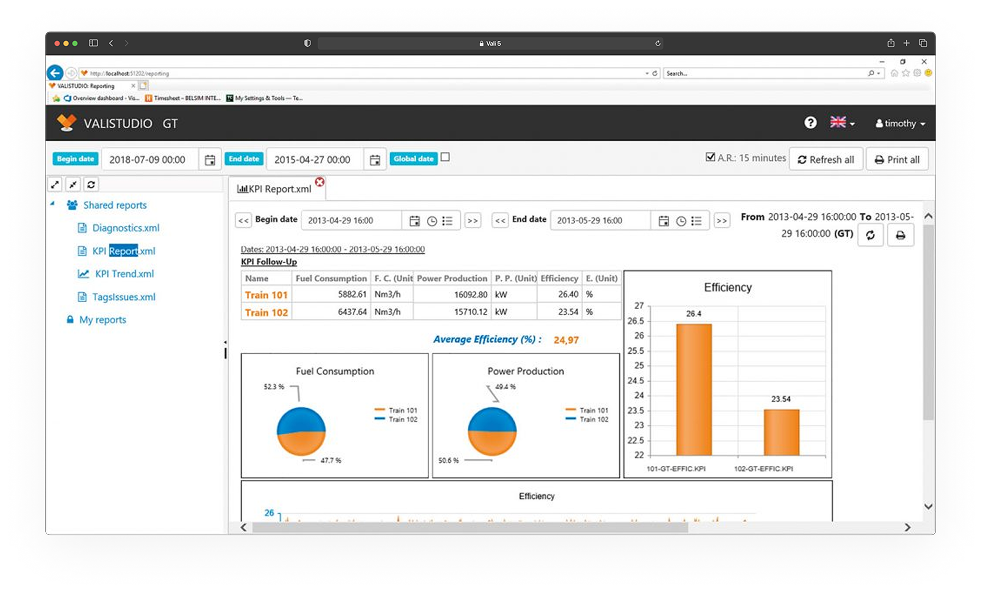
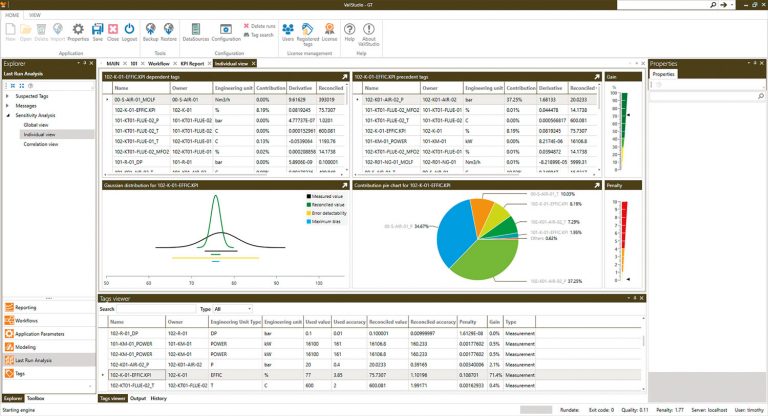
Process measurements are introduced through tags, with their respective uncertainties.
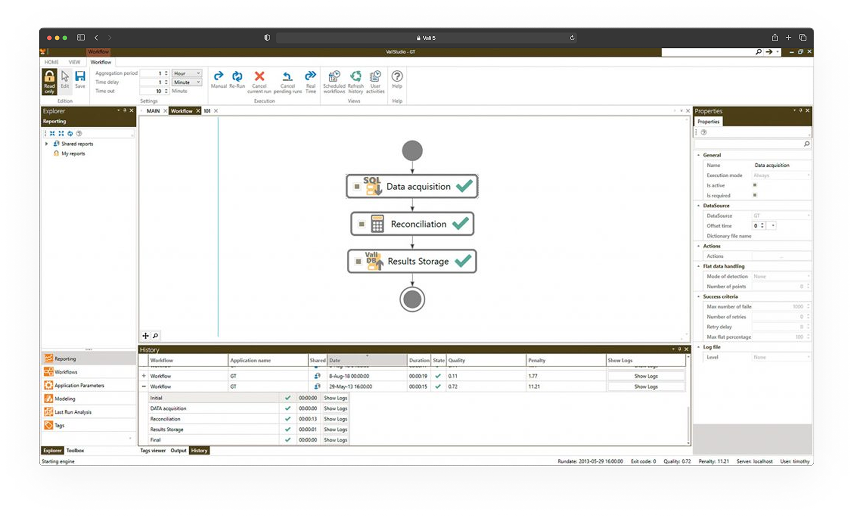
Additional equations can be implemented through an internal programming code called FLEX, allowing complex performance calculations.
WORKFLOWS
Workflows are configured to run the process model online with a configurable aggregation time going from 15 minutes to 1 day. The graphical representation of these workflows is a flow chart where each object represents one step of the workflow.
A workflow toolbox gives access to the different functionalities :
Data acquisition from different historian system,
Manual data input interface,
Calculations,
Data storage to different types of database,
Email sending,
File management.
The workflow history gives the status of the executed runs with their penalty and quality indexes.
REPORTING
An integrated reporting tool has been developed to provide reporting features such as trends or charts. These reports are seamlessly integrated with the model, allowing a continuity between reporting and modeling inside the application.
The Last Run Analysis section provides access to detailed information related to the most recent calculation performed in the ValiStudio interface.
The reporting toolbox allows configuration of the reports with trends, tables, conditional formatting, formulas, pie charts, etc.
Multiple VALI databases can be used within the same report.
- Results stored in the database can be accessed through other softwares such as Microsoft Excel.
WEB REPORTING
All reports configured within the ValiStudio interface can be accessed through any web browser using the new web reporting tool. This interface allows users to view all application reports without requiring a local ValiStudio installation. As in ValiStudio, users can navigate between dates, consult the most recent calculated data, and easily print reports.
RESULTS ANALYSIS
The Last Run Analysis section provides access to detailed information related to the most recent calculation performed in the ValiStudio interface.
Suspected Tags display a list of measurements showing abnormal behavior, such as data acquisition issues, filtered tags, or flagged measurements.
Messages provide access to calculation logs generated by the engine, including warnings, serious errors, and fatal errors.
Sensitivity Analysis offers meaningful insights into the run and tag behavior, including gain distribution, chi-square tests, tag dependencies, and Gaussian distributions.
Results give access to the run report and its detailed information, including tag values, bounds, and calculation logs.
Debug Information helps identify potential causes of non-convergence by displaying residuals, tag values, and variable values for each iteration of the calculation.